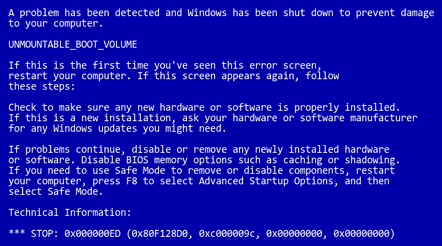
Windows "Blue Screen of Death" crash report minidump files are normally saved in "C:\Windows\Minidump" folder.
Full memory dumps are saved in "C:\Windows\MEMORY.DMP" file.
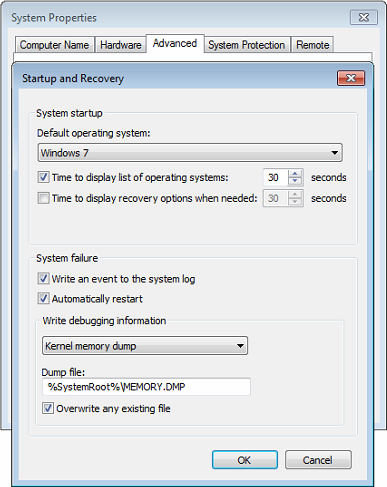
Level of crash information logging can be set in System Properties > Advanced > Startup and Recovery > Settings
WinDbg
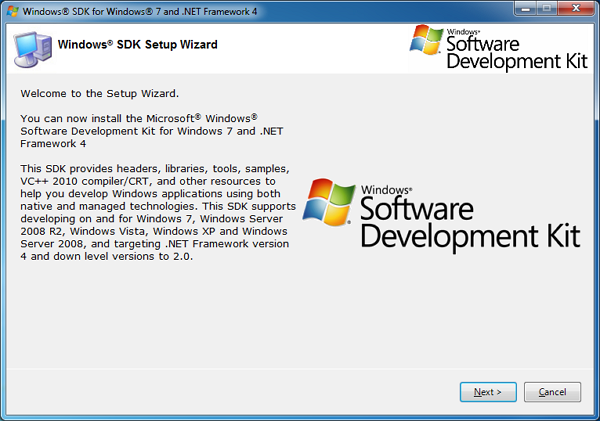
One option to read crash minidump and full memory dump files is to install Debugging Tools for Windows (WinDbg). Windows 7 version can be download from here (or check Microsoft MSDN website for most up to date version for your system).
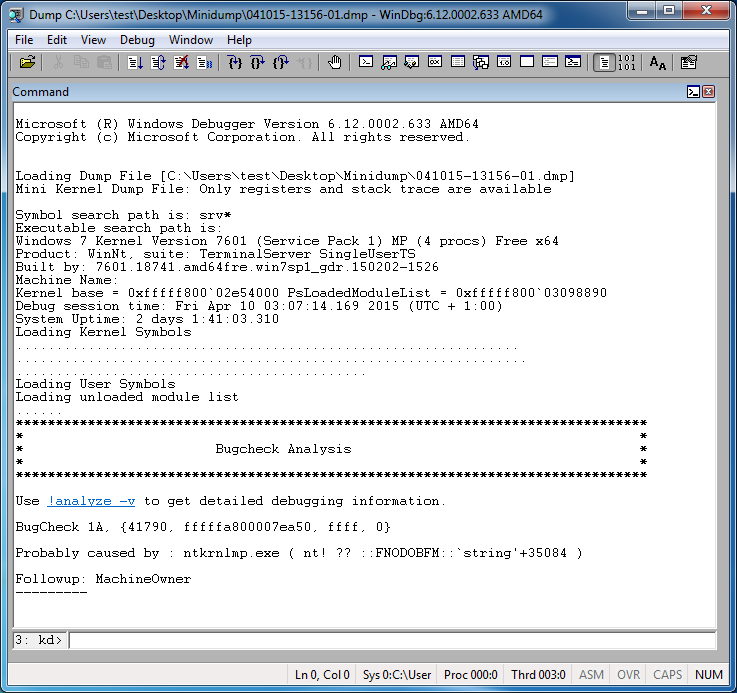
After installation run WinDbg, go to File > Open Crash Dump and point to your crash dump file.
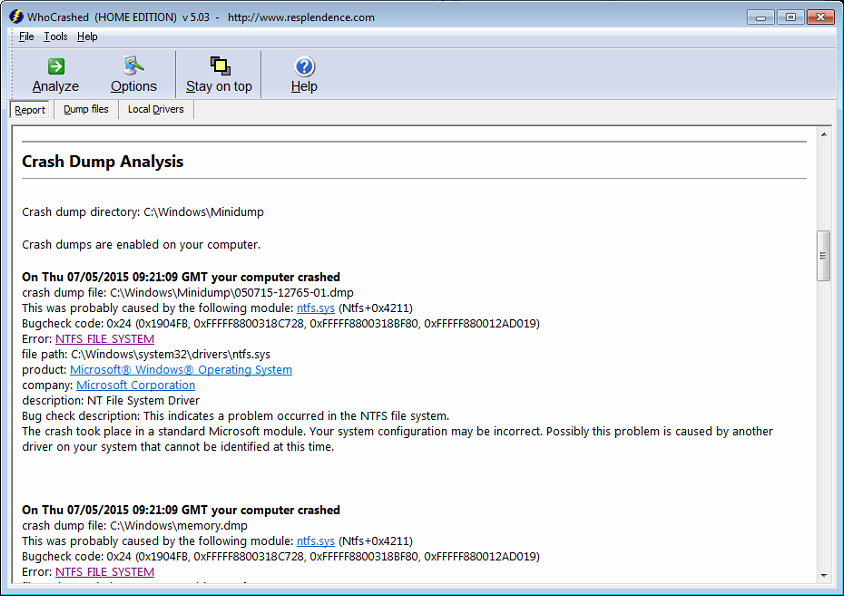
Look at the bottom of the report for the line: Probably caused by : ...
i.e. Probably caused by : ntkrnlmp.exe
This won't necessary tell you exact cause for the crash, but it's a good first step in trying to figure out what is happening.
If the debugger report gives you errors similar to: "Symbols can not be loaded" or "Your debugger is not using the correct symbols", run following commands (enter them in the CLI line at the bottom of the debugger):
.symfix
.reload
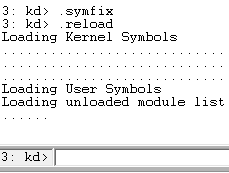
Then re-run the debugging (CTRL+SHIFT+F5)
WhoCrashed
Another, slightly more user friendly option to read Windows crash report dump files, is to use a too called WhoCrashed from Resplendence Software. WhoCrashed (Home Edition) v 5.03 can be download from here. For latest versions and for Professional edition (to be used in commercial environment) check developer's website.
If reason for system crashes is some third party driver, solution is pretty obvious - remove or update the offending driver. If "Blue Screen of Death" is caused by one or more critical system or kernel components the first course of action would be to test your RAM and system Hard Drive for errors.